

 The Charis Circle
50 likes
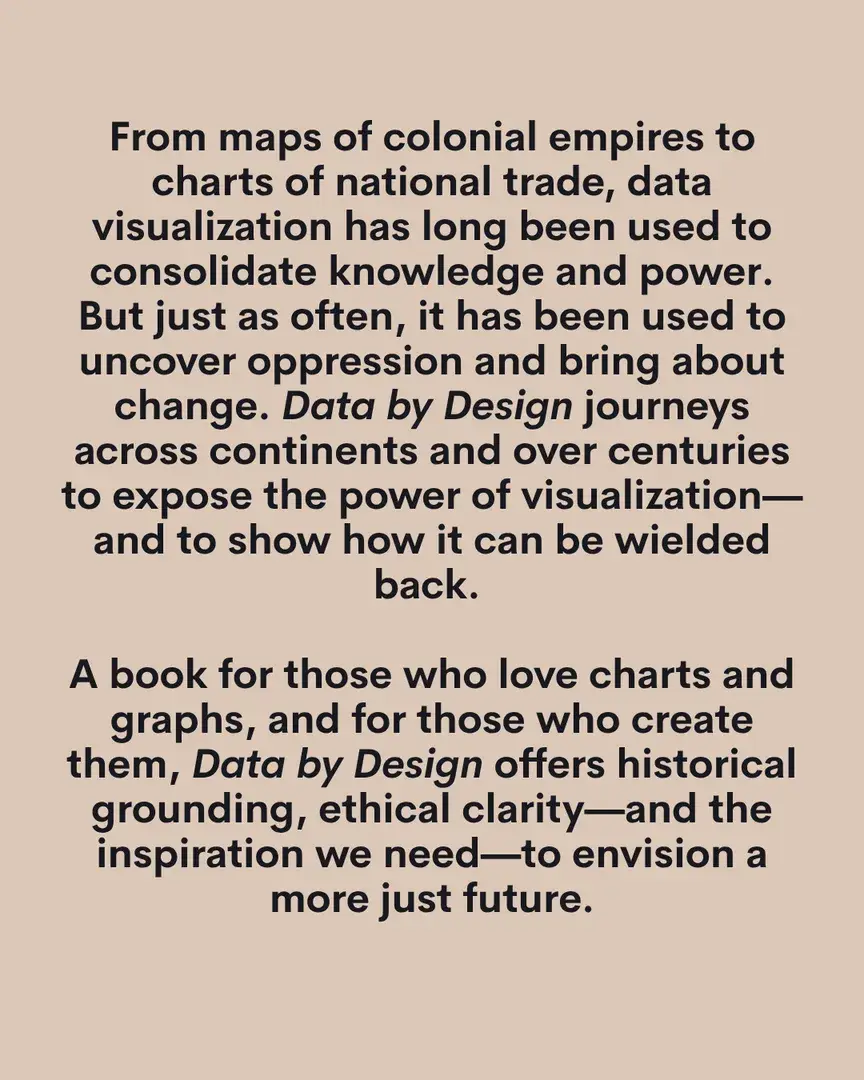
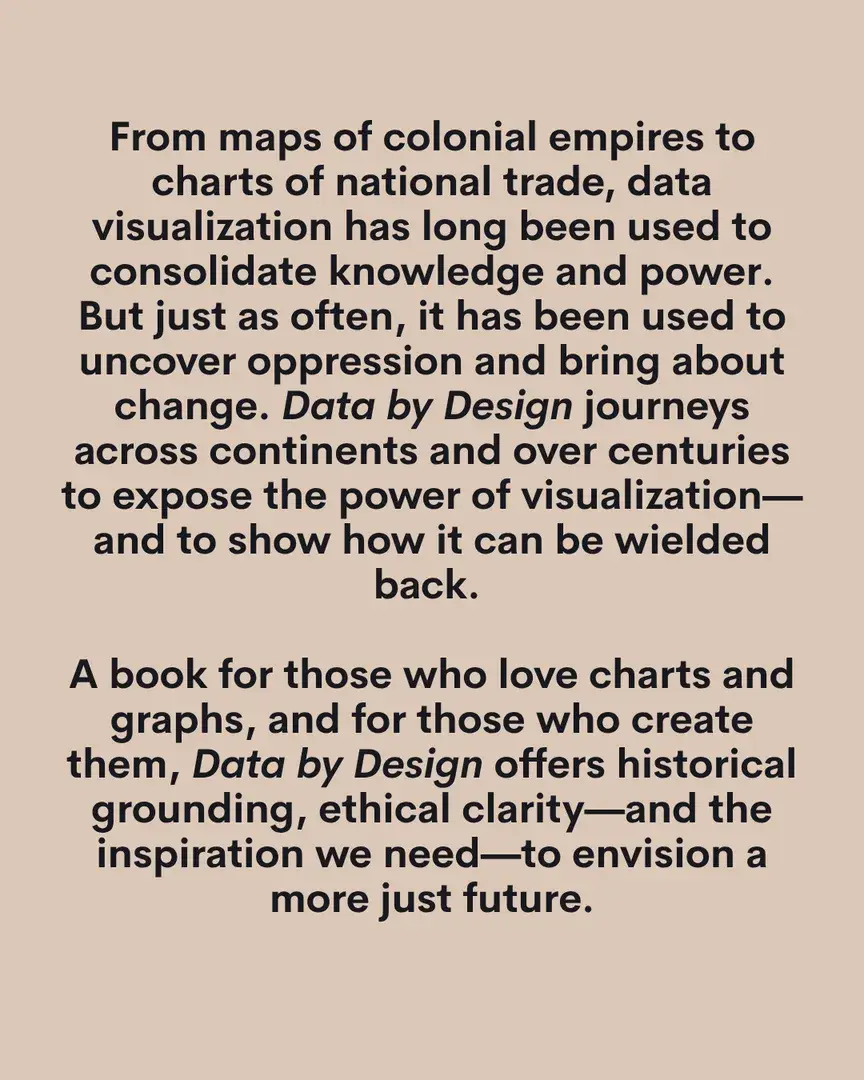
From maps of colonial empires to charts of national trade, data visualization has long been used to consolidate knowledge and power.
But just as often, it has been used to uncover oppression and bring about change. Data by Design journeys across continents and over centuries to expose the power of visualization—and to show how it can be wielded back. A book for those who love charts and graphs, and for those who create them, Data by Design offers historical grounding, ethical clarity—and the inspiration we need—to envision a more just future. Charis welcomes Lauren Klein for a discussion of Data by Design: Visualization and Power from Abolition to the Dawn of Data Science (@lauren_f_klein) (@dataxdesign.io) (@kanarinkaprojects), which illustrates how the history of data visualization holds the key to designing a more just future. Lauren will be joined by a panel of contributors to the book: Margy Adams (@marguread), Shiyao Li (@shiyaoli557), Tanvi Sharma (@chronictanvi), and Jay Varner. This panel will be moderated by Catherine D’Ignazio. (@mitpress) JANE SCHOENBRUN (@janedoesnotknow) is coming to Atlanta in ONE WEEK!Oct 22962 likes
 We had such a blast at our first Charis After Dark that we had to run it back — this time…Oct 17458 likes
 You do NOT want to miss these September events!Sep 9227 likes
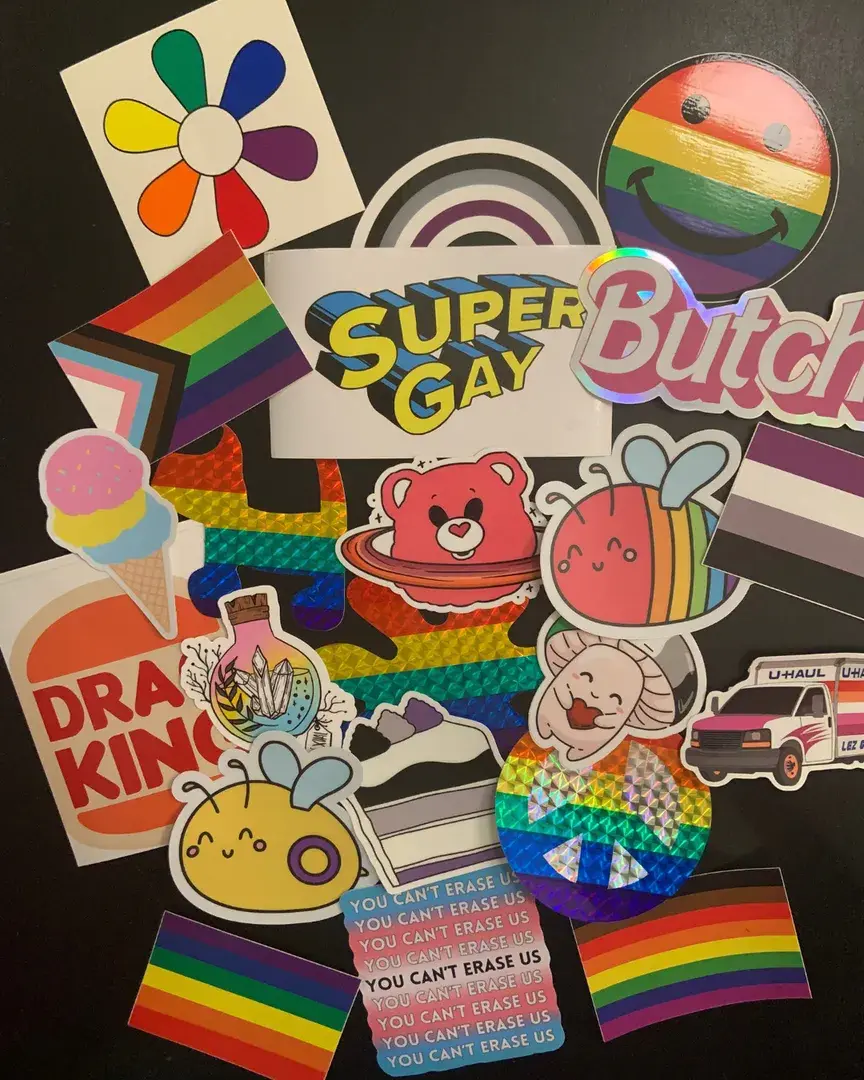 Have a bland water bottle or empty notebook that’s been begging for some personalization?Oct 3189 likes
 The MURPH (@themurphatl) recently finished its installation of beautiful…Jul 29180 likes
 Meet the people helping to make Charis After Dark happen!Oct 30179 likes
 Profound and expansive, a story of lesbian love and longing, art and motherhood…Sep 27171 likes
 In The Disappearers, Marlon James has written a riveting and deeply human story of men…Sep 18139 likes
 The history of the WNBA is an epic one, and in The W…Sep 30124 likes
 THE Halloween week release of all time is OUT TODAY…Oct 27121 likes
 September is a packed month filled with exciting author events!Sep 1110 likes
 Charis goes to the MOVIES!Oct 18101 likes